
Here in Tucson, the house prices continue to fall. Not only has the housing bubble completely vanished, but the momentum of the market has brought the average price of a Tucson home to less than 90% of its non-bubble inflated price.
The vertical axis of the graph below shows the monthly average house price for a Tucson house divided by an estimated 5.1% growth curve. The horizontal axis indexes time in months from 1988 to 2009. A 1.0 on the vertical axis means the average house price has sustained a 5.1% growth during this period. The 5.1% growth was estimated by curve fitting (using a compound interest model) over the pre-bubble data from 1988 to 2003 (seen as the relatively flat part of the graph). The Standard Deviation of the normalized average house prices from 1988 to 2003 is 4.04%.
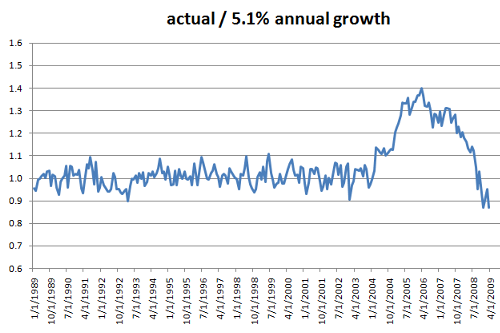
The bubble can be seen to start in early 2004 and grow to a maximum in March of 2006. At that time, the peak normalized average house price for Tucson was at 1.39, or simply put, Tucson homes were 39% overvalued on average. Since 2006, the housing market has been in steady decline with an abrupt drop starting in mid-2008 and continuing through March 2009.
The values I used are not adjusted for CPI. Some of the 5.1% growth rate from 1988 to 2003 is not realized due to inflation. While I do not know the inflation rates for Tucson, AZ over this period, the national CPI over the same period varied from 3 to 4%. This implies that realized equity in Tucson homes only increase by ~1.5% annually.
In addition, Tucson average home prices typically increase from January to June and then decrease from July to December, but even this trend is overcome by the dropping home prices. Presently, the average home price is 88% of its normalized value.
Looking for a great deal in a new home? Try Tucson! Looking for a better deal? Wait a few months more.